
BUSINESS
Nifty Falls to a Three-Month Low on $101 Oil
Nifty 50 closed at a three-month low as $101 Brent and a 4.836 percent U.S. 10-year yield kept sell-on-rise in force.

The Nifty 50 fell 0.86 percent to 23,431.50 on 9 September, its third straight drop and the lowest close since 11 June. Brent crude settled at $101.21 the same day, and the U.S. 10-year yield rose to 4.836 percent, the highest since 31 October 2023. That mix is what keeps a sell-on-rise bias in force even with the 14-day RSI at 26.44.
GIFT Nifty pointed 62.20 points, or 0.26 percent, lower at 23,490 heading into the 10 September session. The cash bounce some desks wanted still has to clear oil that is holding above $100 and a rupee that has already slipped through 95.
A Third Red Day and the June Floor
The index opened 113 points lower, bounced, then gave back more than 140 points from a session high of 23,571 and finished near the day’s low. The Sensex dropped 813.35 points, or 1.08 percent, to 74,764.23. Bank Nifty lost 482 points, or 0.85 percent, to 56,296. Across the three sessions through 9 September the Nifty is down 1.95 percent and the Sensex 2.29 percent, and both closed at their weakest levels since 11 June, under the July low of 23,606.
Infosys, HDFC Life and HCLTech led the Nifty 50 lower. Nifty IT was the top drag, down more than 3 percent. Nifty Metal was the only sectoral index to finish higher. The Nifty Midcap 100 and Nifty Smallcap 100 each lost 0.5 percent. Adani Enterprises, Max Healthcare and Adani Ports were the rare gainers in the benchmark.
THE TAPE BEHIND THE CLOSE
- RSI: The Nifty 14-day RSI dropped to 26.44, which puts it in oversold territory, while Bank Nifty’s RSI sat at 35.90.
- Put-call ratio: The Nifty PCR slipped to 0.75 from 0.83, a reading that tracks more call selling than put selling.
- Stock positioning: Short build-up showed up in 98 stocks, against long build-up in 30, long unwinding in 52 and short-covering in 35.
- India VIX: The volatility index jumped 6.81 percent to 11.92, above its short-term moving averages and still below the 12-13 band desks flag as discomfort for bulls.
The daily candle was red with an upper shadow after a gap-down open, which is selling at higher levels rather than a washout at the low. All key moving averages on the Nifty are sloping down. The MACD line kept falling, and the red histogram bar widened for a third session on the Nifty and a seventh on Bank Nifty. Oversold can produce a bounce. It has not yet produced a higher high.
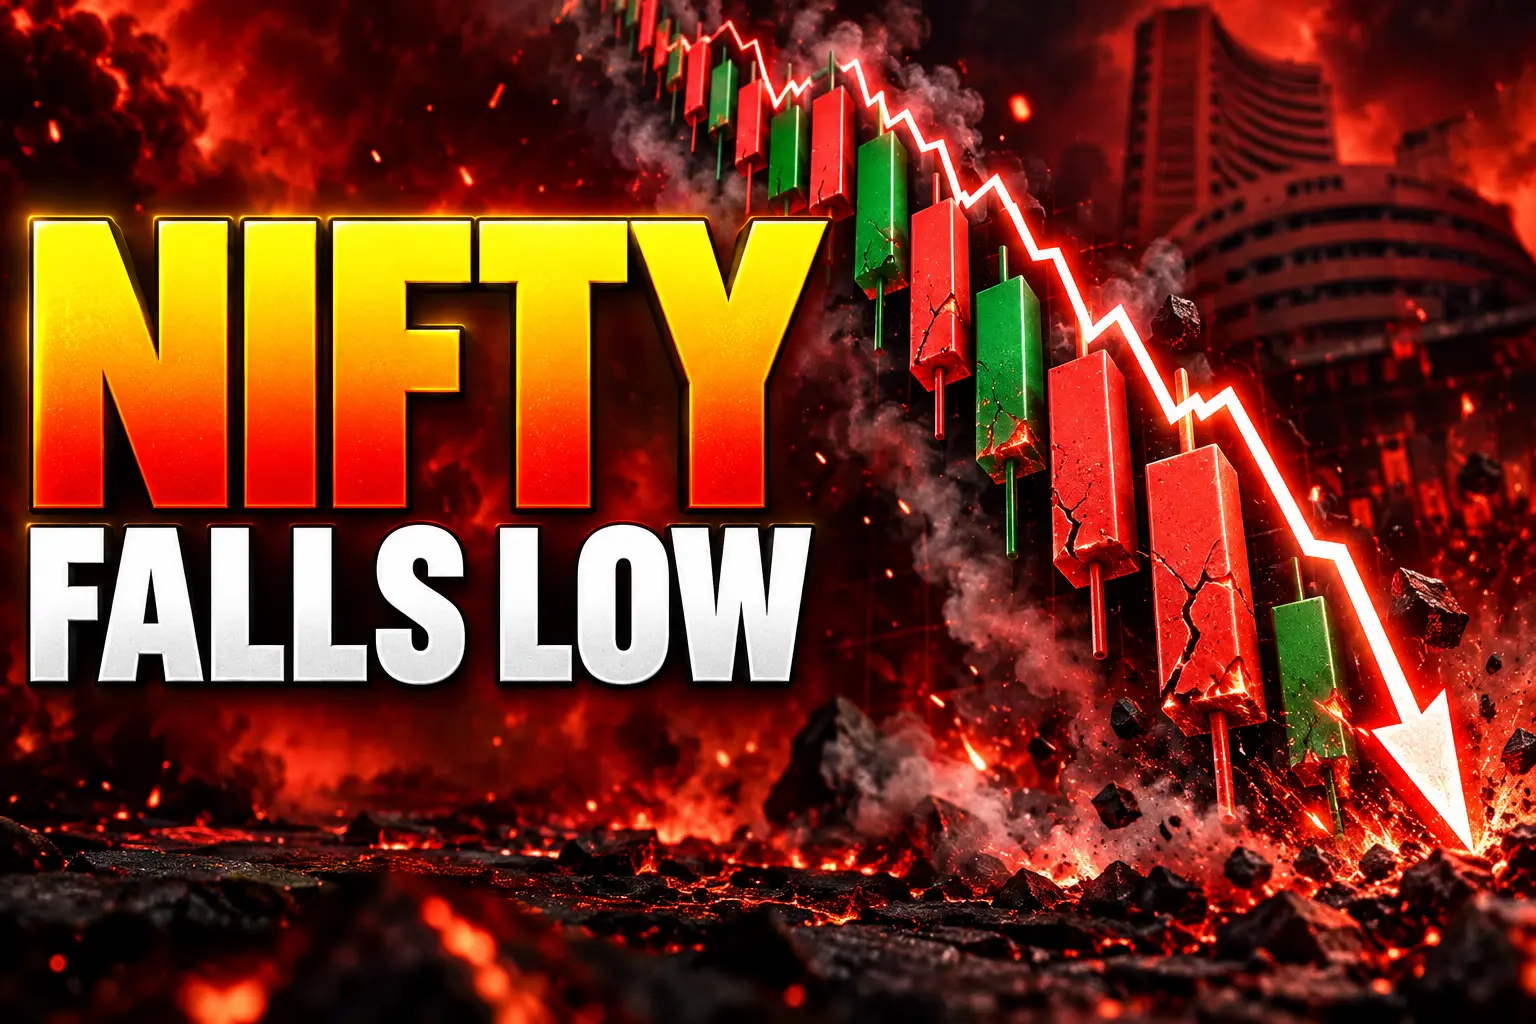
Brent at $101 Hits India’s Import Bill
Brent rose 3.36 percent on 9 September and settled at $101.21, the first close above $100 since 24 July and the highest settlement since 22 May. West Texas Intermediate rose 3.25 percent to $96.05. Early on 10 September, Brent held at $101.10 and WTI at $96.24. Dated Brent, the physical benchmark against which about two-thirds of supply is priced, has been above $100 since 3 September, per LSEG data.
Prices have surged nearly 30 percent from the early August lows after a lasting ceasefire in the six-month U.S.-Iran war failed to appear. Fighting began on 28 February. Brent had already printed $126.41 on 30 April. This week the U.S. Navy sank five Iranian tankers after missile attempts on a U.S. warship, Iran said it struck 10 ships near the Strait of Hormuz and a U.S. base in Jordan, and Iran-backed Houthis hit Saudi energy sites. Hormuz carried roughly a fifth of global oil and gas before the war. Flows remain far below that.
THE SQUEEZE THAT REACHED MUMBAI
- 28 February 2026: U.S.-Iran fighting begins and Hormuz traffic starts to seize up.
- 30 April 2026: Brent peaks at $126.41 on the first supply shock.
- 8 June 2026: The Nifty prints a swing low at 23,070, the number desks still use as next support.
- 3 September 2026: Dated Brent stays above $100 as physical cargoes tighten.
- 9 September 2026: Brent settles at $101.21, the Nifty closes at 23,431.50, and the U.S. 10-year yield hits 4.836 percent.
The U.S. Energy Information Administration, in its September Short-Term Energy Outlook, raised its 2026 Brent average to about $91 a barrel from $87 and its 2027 average to $74, with the forecast completed on 3 September, before this week’s tanker strikes. The agency says global inventories have dropped by 400 million barrels this year and will keep falling through the end of 2026. Middle East shut-ins rose to 6.7 million barrels a day in August from 5 million in July.
The tit-for-tat attacks suggest oil flows from the Persian Gulf are likely to remain disrupted for the foreseeable future.
Daniel Hynes, ANZ analyst, in a client note
Amit Pabari, managing director at CR Forex Advisors, said India imports nearly 90 percent of its crude, and that every $10 rise in oil can add roughly $12-15 billion to the annual import bill. That is the second-order hit the candle chart does not show. Higher crude pulls dollars out of the rupee, lifts the local fuel bill, and keeps foreign funds cautious on an oil-importing equity market even when the RSI looks washed out.
Why a 4.836% U.S. Yield Lands on Dalal Street
The 10-year Treasury constant-maturity yield rose 0.030 percentage point to 4.836 percent on 9 September, based on 3 p.m. ET Tradeweb FTSE closing prices. That is a new 52-week high and the highest yield since 31 October 2023. The note is up 0.075 point over three sessions, up eight of the past ten, up 0.683 point this year, and up 0.883 point from its 52-week low of 3.952 percent on 22 October 2025.
A higher U.S. 10-year yield makes dollar assets pay more for less risk. Foreign money that might have bought Indian cash equities can sit in Treasuries instead, and the rupee has to fund a larger oil bill in the same dollar. Nifty IT’s slide fits that tape: U.S. discount rates and a firmer dollar both lean on exporters, which is why Infosys and HCLTech were in the laggard list on a day when crude was the headline.
Wall Street finished lower overnight, with the Dow off 0.77 percent, the S&P 500 off 0.48 percent and the Nasdaq off 0.64 percent, as oil and the yield moved together. Asia opened in the red, with the Nikkei down 0.84 percent, the Kospi down 1.1 percent and the Hang Seng down 1.2 percent. Mumbai is not running a local technical event. It is importing a funding shock.
2,76,250 FII Shorts Versus DII Cash
Domestic institutions absorbed the cash selling. Foreign institutions did not. NSE’s combined cash-market FII and DII figures for 9 September, covering NSE, BSE and MSEI, show the split in the two books that actually move the index.
THE TWO BOOKS ON 9 SEPTEMBER
| Book | Net | Read |
|---|---|---|
| FII cash | -Rs 582.99 crore | Second straight cash sale (bought 16,392.90, sold 16,975.89) |
| DII cash | +Rs 1,509.04 crore | Domestic funds bought 18,130.76 and sold 16,621.72 |
| FII index futures | -2,76,250 contracts | Net short, raised by 14,693 contracts, worth -Rs 2,258 crore |
| Client index futures | +2,30,480 contracts | Retail still net long |
Combined cash flow was a net +Rs 926.05 crore, and the Nifty still fell 0.86 percent. The leak is in futures. FIIs hold 88.98 percent of their index-futures open interest on the short side and 11.02 percent long, against total index-futures open interest of 3.54 lakh contracts. Anil Singhvi, the Zee Business managing editor, had the same 11.02 percent long share on his 10 September board. Clients are on the other side of that trade.
Foreign funds have been net sellers of index futures on every session of the September series, offloading Rs 14,477.39 crore across 11 sessions, with Nifty futures open interest around 2.70 lakh contracts, the most since 13 April 2026. Dharmesh Bhatt, head of derivatives research at Systematix Institutional Research, said FIIs added about 54,200 contracts of net shorts since the series opened on 25 August at 1,84,227 net short, and that the pace picked up over 7-9 September. He put the short-to-long ratio at 8:1. Retail, he said, holds more than five long bets for every short.
Bhatt also noted that the last time FII net-short positioning got this stretched, the Nifty found a floor almost exactly there before rallying into July. That is the bounce case. It sits next to oil still above $100 on 10 September, which is why a relief rally can print and still be sold.
23,070 Is the Support Desks Keep Naming
Nagaraj Shetti, senior technical research analyst at HDFC Securities, said the 23,600 level, matching the 15 June opening upside gap, has been broken, and that the next downside is around 23,070, the 8 June swing low. Any pullback, he said, could stall near 23,625. Sudeep Shah, head of technical and derivatives research at SBI Securities, put crucial support at 23,330-23,300, with a break opening 23,170-23,150, and 23,620-23,640 as the immediate hurdle in the 9 September gap. Rupak De, senior technical analyst at LKP Securities, said a close above 23,500 on 10 September could bring a meaningful recovery, while a fall below 23,400 could extend the correction. His futures plan was to sell between 23,500 and 23,600, stop 23,700, target 23,150.
THE LEVELS ON THE BOARD
- Nifty support: 23,300 first, then 23,070, with Shah’s deeper band at 23,170-23,150 and Nandish Shah of HDFC Securities pointing to 23,172.
- Nifty hurdle: 23,500-23,600 as the sell-on-rise zone, then the 23,570-23,630 bearish gap flagged by Osho Krishan of Angel One, with 23,800 as a higher cap.
- Bank Nifty: Shah’s support at 55,900-55,800, with 56,800-56,900 as the first hurdle; a break of 56,000 also opens 55,600-55,500 on other desks.
- Weekly options: Maximum Call open interest at 24,000 (1.17 crore contracts), then 23,700; maximum Put open interest at 23,500 (80.46 lakh contracts); heaviest Call writing at 23,500, which added 72.18 lakh contracts.
Shrikant Chouhan, head of equity research at Kotak Securities, put day-trader resistance at 23,550 and 75,300 on the Sensex, with room down to 23,300-23,200 and 74,300-74,000 while those caps hold. Pivot supports on the Nifty sit at 23,425, 23,392 and 23,338; pivot resistances at 23,532, 23,565 and 23,618. Bandhan Bank was added to the F&O ban list, where Inox Wind, Kaynes Technology India, LIC Housing Finance, Manappuram Finance and SAIL remain. No name came off.
A bounce from 26.44 on the RSI is the obvious trade. The futures book says foreign funds are still adding shorts into that oversold print, and weekly Call writing is stacked at 23,500, which is exactly where De and the broader tape want to sell. Relief is likely. Trend change is not the base case until 23,600 is reclaimed on a close.
The Rupee Slips Through 95 Against the Dollar
The rupee settled at 95.11 on 9 September, down 29 paise, after opening at 94.80 and printing an intraday low of 95.22. Dilip Parmar, senior research analyst at HDFC Securities, said Reserve Bank of India onshore dollar sales, and talk of sell-buy swaps, helped the currency recoup some of the early drop. Anuj Choudhary, research analyst at Mirae Asset Sharekhan, tied the fall to crude above $100, global risk-off and FII outflows. On 10 September morning the rupee opened at 95.15 and slipped to 95.33.
Oil marketing companies feel the import bill first. Banks feel the foreign-flow and yield tape. IT already showed it on 9 September. Domestic funds can keep buying the cash market, as they did with Rs 1,509.04 crore, and still not set the index if the futures short is 2,76,250 contracts and Brent is holding $101. The cheap VIX at 11.92 means that short book is not paying much for protection, which is comfortable until 23,300 goes, and then it is not.
Early 10 September trade had the Nifty a little higher around 23,450 after that weaker GIFT cue, which is the bounce the oversold camp wanted. It still has to live with dated Brent above $100, a 10-year yield at 4.836 percent, and foreign funds that spent the September series selling every index-futures session. Until those three ease, 23,500-23,600 remains a place to sell, and 23,070 remains the number the June chart has not cancelled.
Disclaimer: This article is news reporting and market analysis for information only. It is not investment advice, a recommendation to buy or sell any index, stock, future or option, and it is not a substitute for a plan built around your own holdings and risk limits. Speak with a SEBI-registered investment adviser or a qualified financial planner before acting on any level, strategy or flow figure mentioned here. Index closes, oil prices, Treasury yields, rupee prints and positioning data are those published for 9 September 2026, with early 10 September cues where stated, and all of them can change in the next session.

Margaret Hamilton Dies at 90 With Her Prevention Fight Unfinished

Texas Executes Jamaal Howard After Tennessee’s Failed Injection

The Next Kia Sportage Leaves Its Cheap Compact Formula

Alaska Airlines Builds the Costly Long-Haul Model It Undercut

OpenAI Agents Probe Census and Education Sites for Public Data

Alfalfa Sprouts Outbreak Follows 16 Months Without Reinspection

Instagram First Draft Pulls the Rough Cut In-House

Rene Haas Ties an AI Cancer Cure to Scarce Chips

Himalayan Glacial Flood Risk Outran Nepal’s Lake Maps

As Kids Get Better at Faces, Angry Women Get Harder
-
 LIFESTYLE2 months ago
Alfalfa Sprouts Outbreak Follows 16 Months Without Reinspection
-
 NEWS2 months ago
Instagram First Draft Pulls the Rough Cut In-House
-
 NEWS1 month ago
Rene Haas Ties an AI Cancer Cure to Scarce Chips
-
 NEWS1 month ago
Himalayan Glacial Flood Risk Outran Nepal’s Lake Maps
-
 NEWS1 month ago
As Kids Get Better at Faces, Angry Women Get Harder
-

 NEWS1 month ago
AI Influencer Labels Fail to Protect Body Image
-

 NEWS1 month ago
NSA Wants AI to Sift Intercepts It Cannot Finish
-

 BUSINESS1 month ago
The H100 Rental Spike Nvidia Cited Has Already Faded